Advanced Excel & Data Visualization for Business Success
Master Advanced Excel, Power BI, and Tableau for Data Analytics, Automation, and Business Insights.
- Certification from EICTA consortium upon project completion.
- 100 Hours of blended learning – 35–40 hours of live sessions + 60 hours of hands-on assignments (4 Weeks Training Program)
- Hands-on experience in Excel automation, advanced analytics, dashboards, and visualization using Power BI & Tableau.
- Real-world business case studies and capstone project for practical exposure.
- The training will be held in two slots: 17th Dec 2025 – 30th Jan 2026 and 22nd Jan – 13th Mar 2026, with evening batches post 5:30 PM
Select Mode:
Winter Training
Online Live
80 Hours
What you'll learn
- Advanced Excel functions for financial, statistical, lookup, logical, text, date & time operations.
- Efficient data management with sorting, filtering, PivotTables, and data cleaning techniques.
- Automation of repetitive tasks using Macros and VBA.
- Building dynamic dashboards and interactive reports in Excel.
- Exploratory Data Analysis (EDA) and data-driven decision-making.
- Integrating Excel with Power BI and Tableau for visualization and storytelling.
Skills you'll gain
Tools


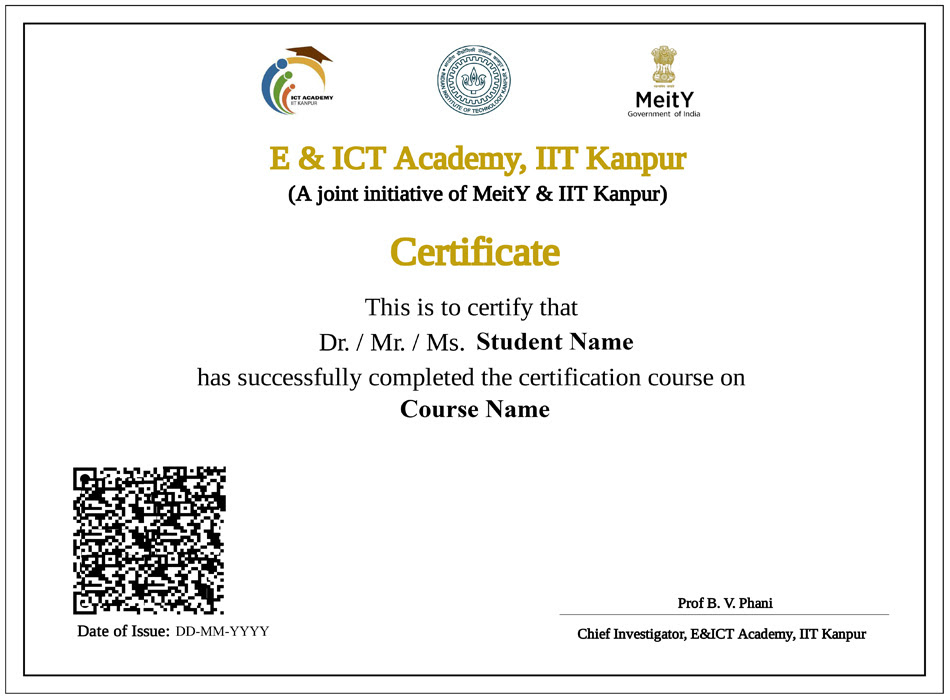
Earn a career certificate
Add this credential to your LinkedIn profile, resume, or CV. Share it on social media and in your performance review.

Expert-Led Live Sessions
Learn from experienced instructors through online, instructor-led sessions that combine hands-on exercises, real-world case studies, and interactive mentorship support, providing a comprehensive and engaging learning experience.
Project-Based Learning
Complete assignments and a final business case study project to gain practical exposure, and receive a Project Letter upon successful completion of the capstone project.
Flexible Online Training
Attend fully online, live sessions with recorded access, allowing you to learn at your own pace—ideal for both students and working professionals.
Certification
Earn a Certificate from EICTA consortium upon completing the course and project, and enhance career opportunities in business analytics, finance, data visualization, and consulting roles.
Training Slots
The training will be held in two slots: 17th Dec 2025 – 30th Jan 2026 and 22nd Jan – 13th Mar 2026, with evening batches post 5:30 PM


