Advanced Excel with Data Visualization
Master Advanced Excel Techniques and Create Compelling Data Visualizations Using Power BI and Tableau
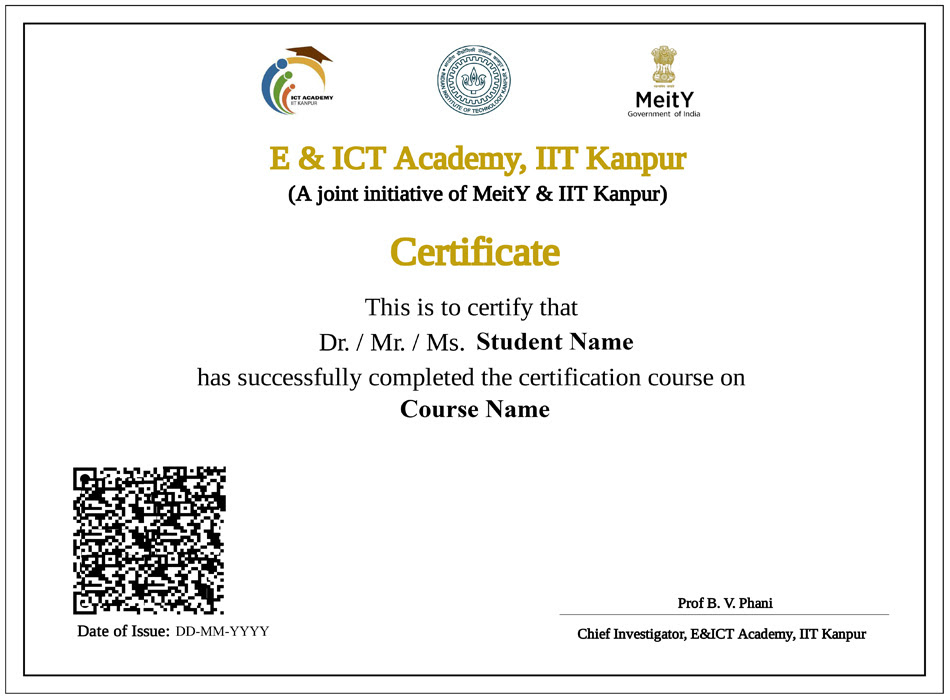
- Certificate of Completion from E&ICT Academy, IIT Kanpur upon course completion
- 120 hours of blended learning: 60 hours of live sessions and 60 hours of assignments
- Hands-on projects and real-world case studies focusing on Excel, Power BI, and Tableau
Beginner Level
Online Live
1 Month
What you'll learn
- Master advanced Excel functions including Financial, Statistical, Lookup, Logical, and Text functions
- Efficiently work with large datasets using sorting, filtering, and PivotTables
- Perform advanced data cleaning and transformation using Power Query and Data Validation
- Automate repetitive tasks by learning VBA Macros to increase efficiency
- Build dynamic dashboards using Excel’s Developer Ribbon and Pivot Charts
- Conduct exploratory data analysis (EDA) in Excel applying descriptive statistics
- Integrate Excel with Power BI and Tableau to combine multiple tools for better decision-making
Skills you'll gain
Tools


Earn a career certificate
Add this credential to your LinkedIn profile, resume, or CV. Share it on social media and in your performance review.

Learn from Industry Experts
Gain insights from seasoned professionals with real-world experience in data analysis and visualization.
Hands-On, Project-Based Learning
Apply concepts through practical exercises and projects to build real-world applications.


