Advanced Excel with Data Visualization
Master Excel Functions, Pivot Tables, and Interactive Dashboards with Tableau & Data Modeling Skills
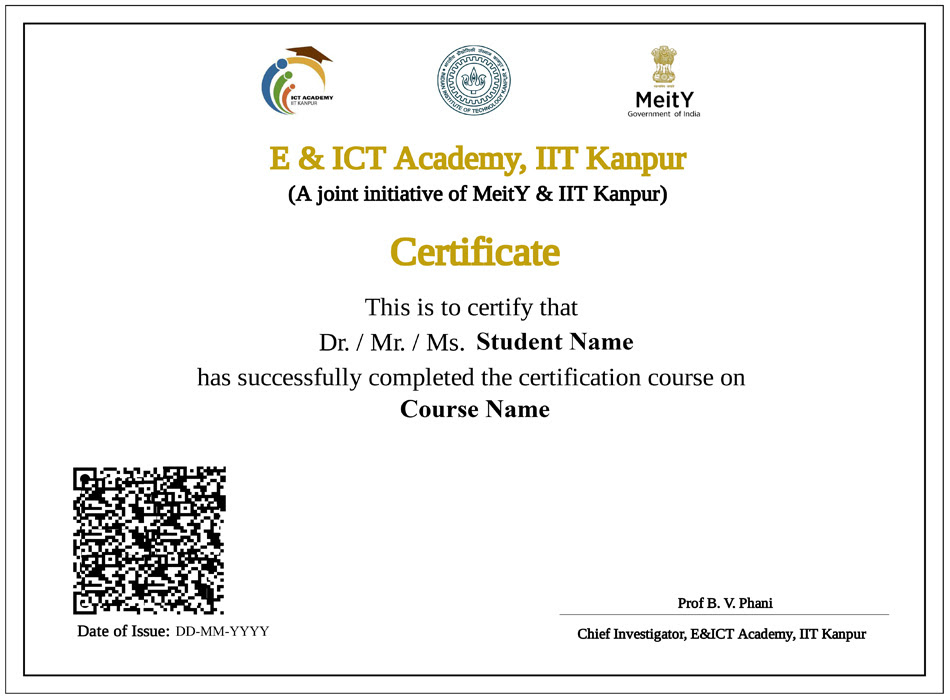
- Certificate from E&ICT Academy, IIT Kanpur upon successful completion
- 10 hours of live, expert-led online training with real-world Excel & Tableau projects
- Learn to create dynamic dashboards, data models, and powerful visual reports
Faculty Development Program
Online Live
10 Hours
What you'll learn
- Perform advanced Excel operations including VLOOKUP, INDEX/MATCH, and dynamic named ranges
- Design professional data models and clean raw datasets for analysis
- Create interactive dashboards using charts, slicers, and PivotTables
- Visualize complex datasets with Tableau and build storyboards for data-driven decision making
- Apply data analysis techniques using formulas, conditional formatting, and data validation
- Automate repetitive tasks with Excel macros and streamline reporting workflows
Skills you'll gain
Tools

Earn a career certificate
Add this credential to your LinkedIn profile, resume, or CV. Share it on social media and in your performance review.

Excel + Tableau Power Combo
Leverage the strengths of Excel for calculation and Tableau for compelling visual storytelling in one unified course.
Hands-On Dashboard Projects
Design real-time dashboards from scratch. Track KPIs, automate updates, and integrate live data sources.
Designed for All Professionals
Ideal for students, educators, marketers, analysts, and managers who work with data regularly.
Short and Impactful Format
Complete this 10-hour course over a few days and walk away with practical reporting and analytics skills.
Recognized Certification from IIT Kanpur
Get certified by E&ICT Academy, IIT Kanpur — ideal for adding credibility to your resume and LinkedIn profile.


